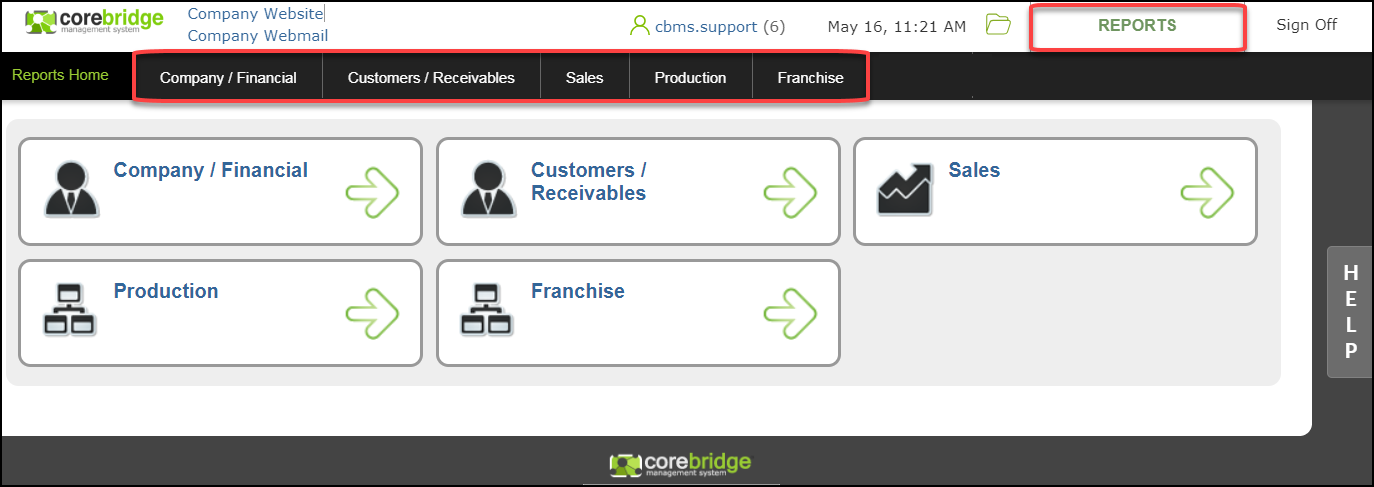
The Reports Module gives you a variety of ways to review your data in real-time. There are five tabs that divide the Reports into specific categories:
- Company/Financial
- Customers/Receivables
- Sales, Production
- Franchise
Within these tabs, there are four ways to see your Reports:
- Summary
- Detail
- Drilldown
- Export.
a. Summary Reports generate your lump sum totals.
b. Detailed Reports give you additional information, such as Invoice numbers.
c. Drill Down Reports give you the option to show or hide information as needed by clicking on the plus or minus buttons to the left.
d. The Export button, found on a few commonly used reports, formats the information you need into a single line, making it easier to import into spreadsheets.

Once you’ve opened a Report, you are able to customize the data that you want to review.
e. You can change the date using the Date Range dropdown or clicking the calendar icon on Beginning/Ending Date to select a range.
f. Included Costs for the Report.
g. Change the Location for the Report here.
h. This Save icon allows you to save in a variety of formats.
i. You can print the Report by clicking the Print icon.

In CoreBridge, most data is reported in real time. However, the Royalty Report is processed in nightly batches and becomes available the following day.
